KrakenD Monitoring with Grafana
KrakenD is an ultra-performant open-source API gateway that can transform, aggregate, or remove data from multiple services with linear scalability.
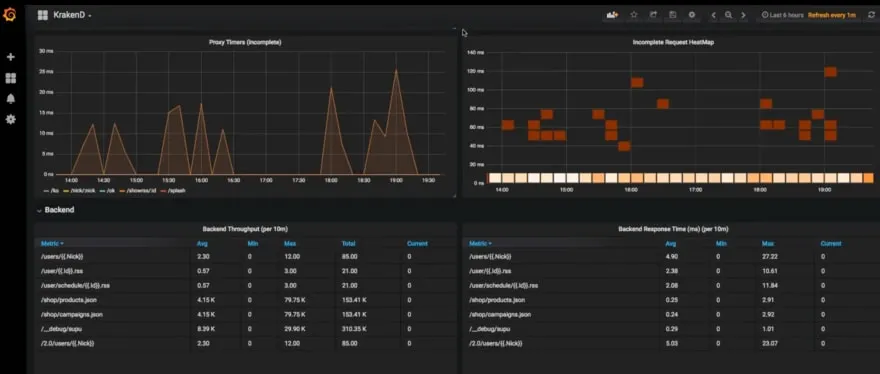
In this post, I’ll walk through how to monitor the status of KrakenD services with a Grafana dashboard.
Instead of building a dashboard from scratch, we can use one of the pre-configured dashboards available on grafana.com. We’ll use the KrakenD dashboard with ID 5722, prepared by dlopez. You can customize it later if you’d like.
By default, this dashboard gives us the following metrics:
- Requests from users to KrakenD
- Requests from KrakenD to your backends
- Response times
- Memory usage and details
- Endpoints and status codes
- Heatmaps
- Open connections
- Throughput
- Distributions, timers, garbage collection, etc.
Prerequisites
- KrakenD
InfluxDB Setup
The dashboard reads its metric data from InfluxDB. You can run InfluxDB easily with Docker:
docker run -p 8086:8086 \
  -e INFLUXDB_DB=krakend \
  -e INFLUXDB_USER=myusername -e INFLUXDB_USER_PASSWORD=mypassword \
  -e INFLUXDB_ADMIN_USER=admin -e INFLUXDB_ADMIN_PASSWORD=myadminpassword \
  -d --name=influx-1.8 \
  influxdb:1.8
docker exec -it influx-1.8 /bin/bashGrafana Setup
If Grafana is not yet installed, run it with Docker. After the following command, Grafana will be available at http://localhost:3000:
docker run \
  -d \
  -p 3000:3000 \
  --name=grafana \
  grafana/grafana
KrakenD Configuration
Add the following configuration to your krakend.json at the root level. After this, your KrakenD metrics will start writing to InfluxDB at <your-influx-db-server-ip>:8086.
{
  "version": 2,
  "extra_config": {
    "github_com/letgoapp/krakend-influx": {
      "address": "http://<your-influx-db-server-ip>:8086",
      "ttl": "25s",
      "buffer_size": 0
    },
    "github_com/devopsfaith/krakend-metrics": {
      "collection_time": "30s",
      "listen_address": "127.0.0.1:8090"
    }
  }
}
Importing the Grafana Dashboard
-
Open
http://localhost:3000in your browser. Useadminfor both username and password. -
Click
Configurationin the side menu and find the button to add a data source. Select InfluxDB and fill in the details you provided when starting InfluxDB:- Query Language:
InfluxQL - URL:
http://localhost:8086 - Access:
Browser - Database:
krakend - User:
admin - Password:
myadminpassword - HTTP Method:
GET
- Query Language:
-
To import the dashboard: click the
+icon in the side menu, thenImport. SelectImport via Grafana.com. Enter5722as the ID and clickLoad. Your dashboard is ready — enjoy.